Yes, the ATR (Average True Range) is my #1. It’s not even close. And I have tested thousands.
Most people aren’t going to like this answer because the ATR does not predict price movement, and this is “boring”.
Those people are doomed to fail.
This site is not for them anyway.
The World’s Best Forex Indicator Is…….
The Average True Range indicator. Also known as the ATR Indicator.
It turns out, it wasn’t some obscure, finely-tuned indicator out of the Ukraine this whole time. It was one that already comes standard with every MT4 charting platform, and one that many people already know. If you don’t know about it, we will discuss.
And as usual, most traders who do use it, use it the wrong way. They make up the 99% of failed traders. Don’t be like them.
But what makes the ATR so great, is how it’s the single most important tool for Money Management. And Money Management is the most important thing in Forex trading. It’s not the sexiest, but is the most important. Because…
No Money Management = No Money
And you’re trading Forex to make money, all of you are. Seriously, I want this to be drilled into your head before we go any further.
Watch this if you haven’t yet. It’s one of my shorter videos, and explains the importance of Money Management.
Why Do No Other Forex Indicators Come Close To The ATR?
Most of them try to better predict if price is going long or short. Almost all of them fail at this.
The ones that succeed however, still need other indicators to go with it before best being able to determine which way price is heading.
There is not one stand-alone indicator that can do a great job of telling you where price is going to go.
And believe me, I have tested thousands.
Even the best ones need help. And even the best ones still only tackle the third most important part of Forex trading.
If you didn’t watch the video, those three things, in order, are…
1 – Money Management
2 – Trading Psychology
3 – Trade Entries
Trade Entries are what everyone spends their time on, but Money Management is the one that ultimately determines if your trading account goes up or down.
Again, it’s unsexy, but my real traders out there get it. The instant gratification crowd does not, and this is why they will always fail at trading, and most everything else.
What does the ATR Indicator Do?
If you want an overly detailed definition with a bunch of history and stuff you can’t use, No Nonsense Forex is not the place. Go here instead.
The ATR is actually very easy, and the part the 99% try and use to predict where price is going isn’t even the part you should be using. You’ll soon see.
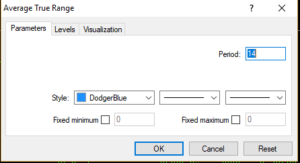
So for this example, I will use the default setting of 14. I use the default setting myself, and I recommend you do as well.
On these settings, all the ATR does is tell you on average, how many pips from top to bottom price has moved in the last 14 candles.
And that’s it. By doing this, it became the world’s best Forex trading indicator. Seriously.
But let’s keep going.
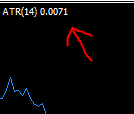
So change nothing, and just hit OK. The indicator will display. You will see a line. Ignore the line. This is where the 99% gets it wrong. All you want is the number displayed in the upper left corner.
So for the daily chart on the EUR/USD, the ATR was 71 pips on July 31st, 2018 as you see in the above picture.
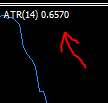
It looks a bit different on Yen pairs.
So the ATR for the Dollar/Yen on the same day is 65 pips, not 6570 pips, in case you were confused.
The markets have been dead slow, so I have no example to show you, but you will often see the daily chart ATR for Yen pairs into the hundreds, which makes one of the numbers go to the left of the decimal. So if the ATR(14) shows 1.13 for example, that’s 113 pips.
Just use common sense, and it will always be easy to figure out from this point on.
Do As I Say, Not As I Do
This is important if you want the most accurate number. The numbers in the examples above could have been much more accurate. I will explain.
First off, I use the Daily chart exclusively. You should too.
If you want the most accurate ATR, you need to look at it about a half hour before the daily candle closes. This allows for the most accurate ATR reading, and still allows you ample time to enter a trade before the end of day close, and spreads start getting ridiculous for an hour or so.
I did not do that. I started writing this just after the 7/30/18 candle closed. Hey, inspiration has no schedule. When it’s time to write, it’s time to write.
But what ended up happening in my example, is I gave you an ATR that was too small. Why?
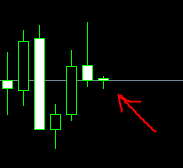
Because the 7/31/18 daily candles — the ones that are going on right now as I write, are freaking tiny. The ATR of that particular candle is like 6 or 7. A number like that is certainly going to mess up the average.
You want to check your ATR indicator after the last candle has likely already made its high and low for the day.
In the numbers I gave to you earlier, that little bitty candle on the EUR/USD daily chart factored in, and made the ATR smaller than it should have been. Don’t do what I did. Do it right.
Trading With the ATR
Now it’s time to show you how to actually trade with the ATR indicator.
I’ll use the example I used in the video I made for this topic. You can watch it here, or I will type it out below.
Fast forward to the 12:16 mark
So in the example, I used the daily chart ATRs of the EUR/GBP and the GBP/NZD.
EUR/GBP = 41
GBP/NZD = 125
You don’t have to be pinpoint accurate here, just know that the ATR of the GBP/NZD is about 3 times that of the EUR/GBP.
If you are the type who trades both pairs, and you really should be, would you trade these two the same way. Would your pip value (how much money you trade per pip) be the same for both pairs?
Of course not. But the vast majority of traders do it this way.
So if you typically trade $6 a pip for most pairs, and that’s how much you would trade on the EUR/GBP, how much money would you use to trade the GBP/NZD?
Again, for most traders, it’s still $6 a pip!! Insanity.
By doing this, you are telling me you are 3 times as confident in your GBP/NZD trades than you are your EUR/GBP trades, and this doesn’t make any sense.
What you ARE doing in this situation is over-leveraging your GBP/NZD position, and one bad trade here can put a serious dent in your account.
All because you were being careless and not using the ATR the way you should have.
The correct approach is to trade $2/pip on the GBP/NZD. This way, you have even amounts of risk on both pairs.
This will take a lot of the spookiness out of trading more volatile currencies, because if you simply do it this way, you can trade any pair you want.
If you would like further instruction (this is a very important thing to get right, so the more the better), you can visit this article as well.
Conclusion
Money Management is everything. No Money Management = No Money
And every video and blog I make from here on out pertaining to Money Management is likely going to have the ATR in it.
It is the World’s Best Forex Indicator because it is the one indicator every Forex trader should be using for every single trade they make. End of story. No other indicator can claim that. Not even close.
If you never come to this site again, but I’ve gotten you to do this one thing, I have succeeded in making you a much better Forex trader. The ATR is too important to ignore. If you don’t use it from this point forward, you don’t belong here.
Have a nice day.
— VP


