The first time we lay eyes on the Parabolic SAR, we’re awestruck.
An indicator showing me a trend reversal, and it’s THAT easy to read??
Too good to be true? Yep.
Parabolic SAR, My Shining Star
This may seem all-too-familiar to you, and it may not, but hear me out.
You discover Forex for the first time.
You’re playing around on your charting software for the first time.
As easy as they are to understand now, back then, even things like Stochastics and RSI weren’t 100% clear to you as far as how to best trade with them.
Then along came Parabolic SAR.
And it all made sense.
When the dots flip, and they are now below price, you go long. When they flip the other way and are now above price, you go short.

Ooooohhhh! Aaaahhhh!
So easy to read. All of these beautiful trends identified! So much money to be made!!
…….at least so it appears.
Instead of fantasizing, let’s break it down in real terms.
“Small” Losses Cancel “Big” Wins With Parabolic Sar
With the Parabolic SAR, the wins are often not as big as they look, and the losses are often bigger than you first think they would be.
First of all, this was a cherry of an example, where there are clear, well-defined entries and exits. Most charts will not be this pretty, and that’s a bad thing when it comes to this indicator.
But let me set you up so you can test the results yourself.
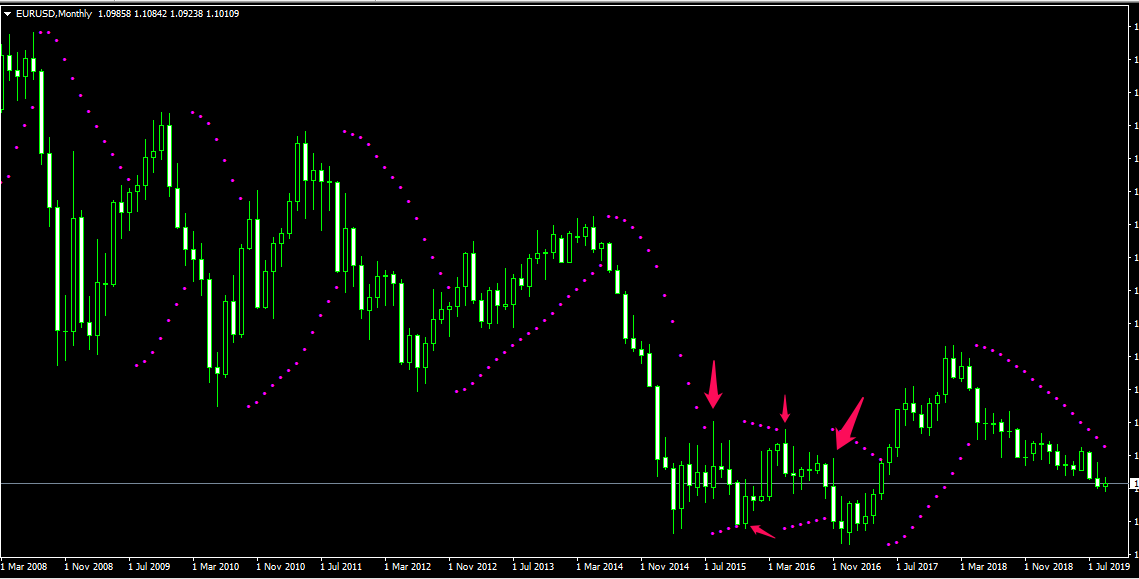
The chart I show in the pictures is the EUR/USD monthly chart.
Important!!
If you really want to see if you would have made money or not, you need to know your own money management system, or how you manage your own trades.
Without this info, again, you’re just fantasizing about the results, and fantasizing is a terrible strategy.
If you don’t have a trade management strategy, mine is one of the best around, and can be found here. It’s an entire video playlist, it may not interest you right this moment, but come up with one for now, and STICK WITH IT.
The Wins
In the fist half of the chart, it was Win City. Every time the dots flipped, you enter.

Where you exit is dependent on your management system, but safe to say regardless, there were some nice wins there.
Problem is, with a good money management system, if a trade runs 600 pips for example, you are not getting all 300, because you (wisely), took some profit before that.
When you do this, you don’t end up with 600 pips of profit, you end up averaging about half that.
It’s a sad reality, but with any good risk profile, this is how the game is best played.
On the other hand, if you get stopped out and lose 200 pips, you lose all 200.
So the game, as we always say here at NNFX, is to mitigate and reduce your losses at every turn.
And the losses were bad. And there were probably more of them than you thought.
The Losses
After the win party came the hangover. 4 losses in a row. Zero chance you made any money on these, it was only a matter of how much you lost.
Those losses don’t look all that big to you, you say? Go to the actual EUR/USD monthly chart and do the math. And again, do it with the same trade management principles you used before.
In some cases, the losses wiped out all of the wins.
In other cases, they didn’t erase all of them, but took out a big chunk of them.
But again, don’t forget the elephant in the room here as I mentioned before….
This is a very favorable example I’m showing you when it comes to the Parabolic SAR.
Other charts will not be this friendly, believe me.
And who trades the monthly chart anyway? It’s pretty much like it never even happened.
Why We Just Can’t Quit Her
For starters, it’s meant to be a reversal indicator, and most traders trade reversals, ESPECIALLY when they first start out.
And even though we all know how that movie ends now, we had no clue when we first started trading.
And by the way, there is no debating its original intent, because the word “reverse” is in the name of the indicator itself!
“SAR” stands for…
Stop
And
Reverse
This would work great if every chart moved in perfect “V” patterns up and down all the time, but reality is almost nothing like this.
But damn does she look pretty when we first see her, and we’re determined to make it work.

“Yeah girl, I know you love that crystal meth, but I’m willing to look past it”
At its core, the Parabolic SAR is just late to the party far too often.
“Well I’ll just adjust the settings”
I’ve done it. A lot. Feel free to do it yourself, but it’s just a faulty indicator at its core, like so many we’ve seen before it.
“Well all I need to do to make it better is combine it with something else”.
Yes, combining indicators does make them better, but combining two or more bad indicators still gets you nowhere.
One of the more common ways people will use the Parabolic SAR is to combine it with the ADX (since they were created by the same person).
The hope is the ADX, which is a volatility indicator, will tell you not to enter those losing trades we saw above by indicating periods of low volatility.
But if we put the ADX on the chart we’ve been looking at, it fails at this task.
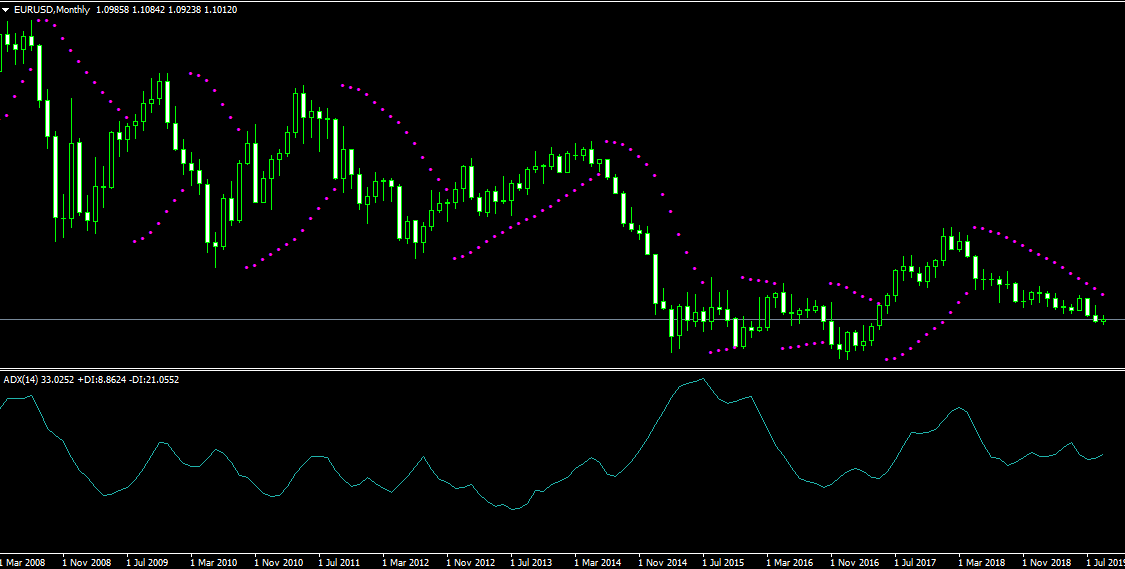
Fail
In most instances above, the ADX levels were even higher in the losing entries as they were the winning ones.
This doesn’t mean you’re completely doomed here — it just means you probably are.
An Olive Branch
With any indicator, the trick is to use the best part of it, and to find other indicators which bring out those qualities.
Even methed-out girl has a good match out there somewhere.
Doesn’t mean it’s gonna be good, or a couple you want to be around, but there is somebody for just about everyone out there.
I don’t like your chances at success here, but what I have found out is this….
Parabolic SAR is not good for reversal trades (almost nothing is), and it’s not great for finding exit points either.
It’s best feature is getting you into CONTINUATION TRADES.
And even then, there are better options in my opinion, but if you really want to see what you can get out of this thing, I’d start there.
The video I made for this topic goes over a good way to get started on that. See below.
For the money shot, you can skip to about the 12:20 mark.
Conclusion
If you came here looking for awesome ways to use the Parabolic SAR, I’m sorry to say, this isn’t it.
I am “that one honest friend” everyone in this game needs, especially early in your trading career, and I’m here to say — dump her.
Or better yet, don’t even ask her out.
Your heart hates me right now. But your head, especially after reading this blog post, knows I’m right.
— VP